

Last week, we dove further into the New Activity trends as broken down by both Price Segment and Location. If you have not yet read this post, then click HERE to check it out!
This week, we are expanding on this conversation as we are now 10 weeks into tracking the New Activity Trends for the Houston Real Estate Market. Below, we will be sharing with you two line graphs:
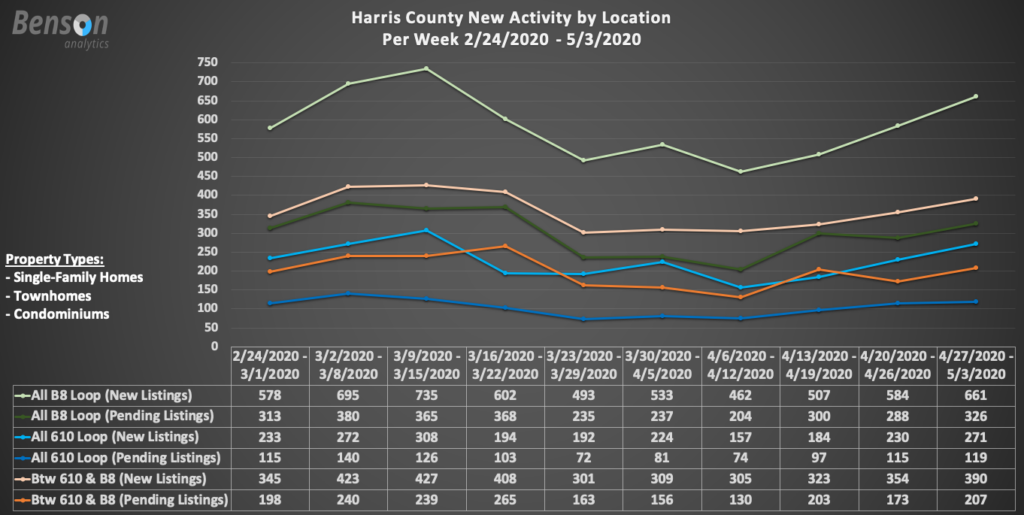
- Harris County New Activity by Location
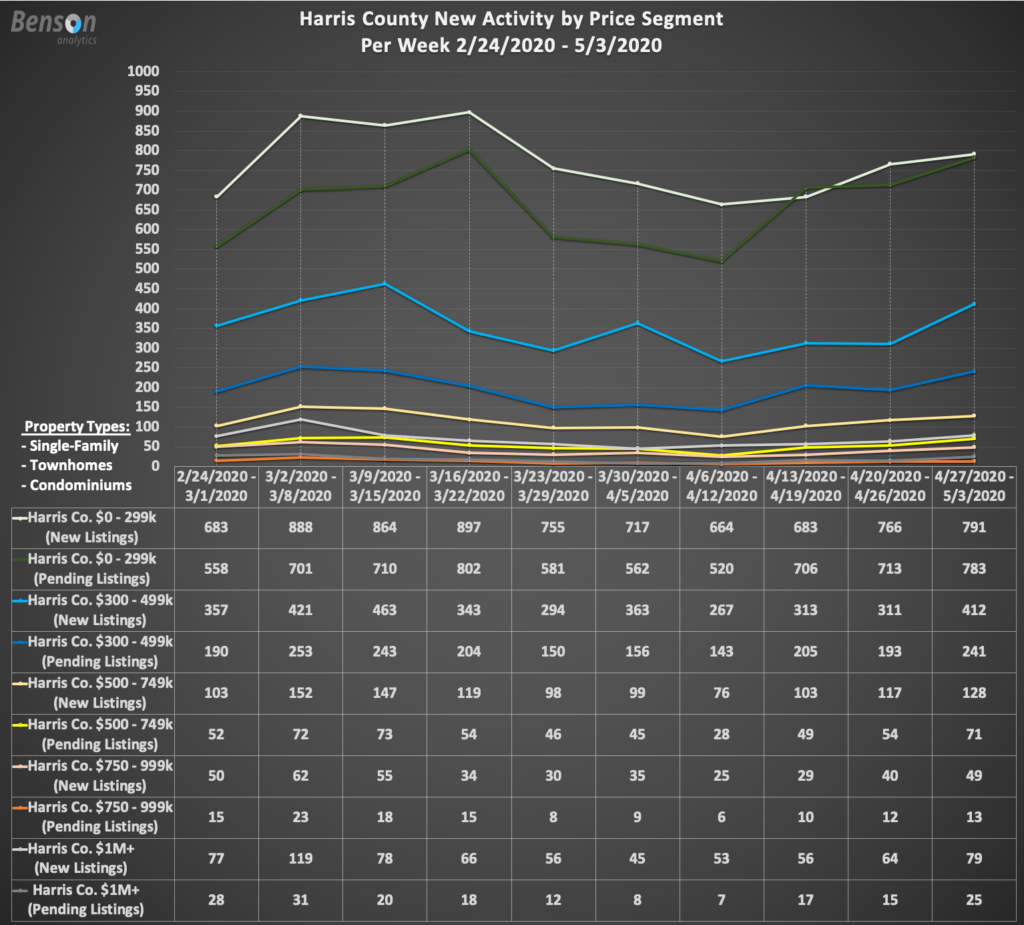
- Harris County New Activity by Price Segment
It’s very encouraging to see yet another week of upward trajectory when it comes to new activity. The last 10 weeks shows both the initial decline of activity and now the uptick; however, one important question must be answered.
How far off was this past week from the 10 week highs for both data sets?
Below, you will see two tables of information breaking down both data sets and comparing this past week to the 10 week high in detail. As mentioned earlier, the new activity of this past week has exceeded the first week; however, activity has not fully recovered.
Here is the table for Harris County New Activity by Location…
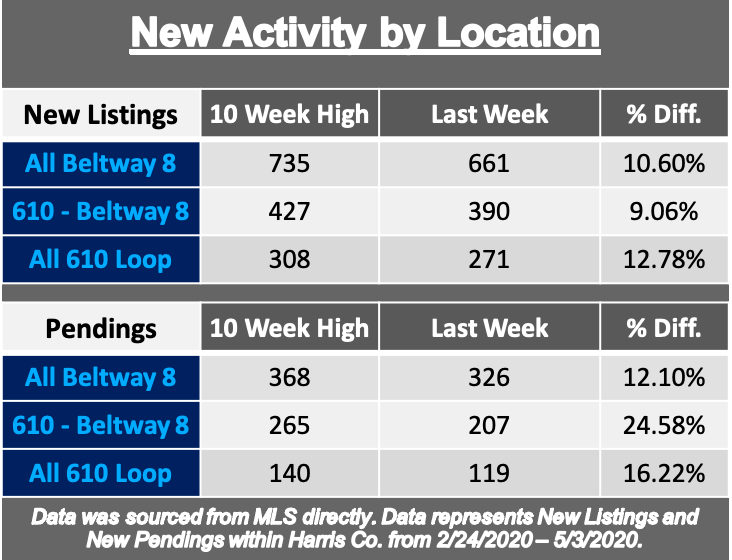
When looking at the location based data set, new listing activity between the 610 Loop and Beltway 8 is drawing closer to its 10 week high in comparison to the 610 Loop alone. The difference is not significant by any means. Newly pended properties show the 610 Loop, by percentage difference, outperforming the area between the 610 Loop and Beltway 8.
Here is the table for Harris County New Activity by Price Segment…
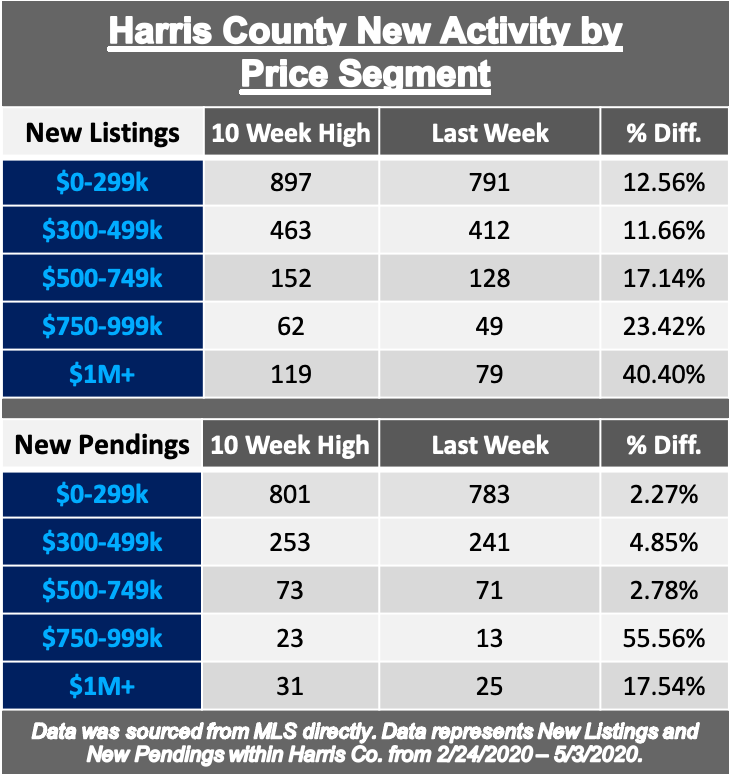
This table is very telling of the market; however, one must take into consideration the distribution of prices within Harris County. This is important for understanding activity shifts in the market place.
The larger the distribution of a particular price segment, the more impactful the shifts.
It’s very encouraging to see the performance of the three lower price segments in terms of new pendings, as they are drawing quite near their 10 week highs. These three segments are very important as they represent over 90% of the Harris County market. Activity overall is still well below normal conditions, but this is positive news. Though it’s nice to see pendings improve, one should hope for new listings to begin to catch up so there is more available in the market place.
Miss This Week’s Market Data Monday? Check It Out Below!
Have any questions about the market? Just Ask!
Harris, Founder