

Since February 24th, we have been closely monitoring new activity in the residential real estate market within Harris County. Though the ‘Houston Area’ goes well beyond Harris Co., we at Benson Analytics have made the decision limit the scope of our research for these studies.
In order to follow daily residential real estate activity for Houston (Harris Co.), follow Benson Analytics on Twitter and Instagram.
As illustrated in recent Market Data Monday videos, I’ve done what I could to keep you in the loop on the daily/weekly happenings in our market. For those who need to catch up, you can find all of the videos on Youtube. This past week, I spoke about the last nine weeks of New Activity in the marketplace.
New activity represents buyers placing homes under contract and sellers making the decision to put their homes on the market.
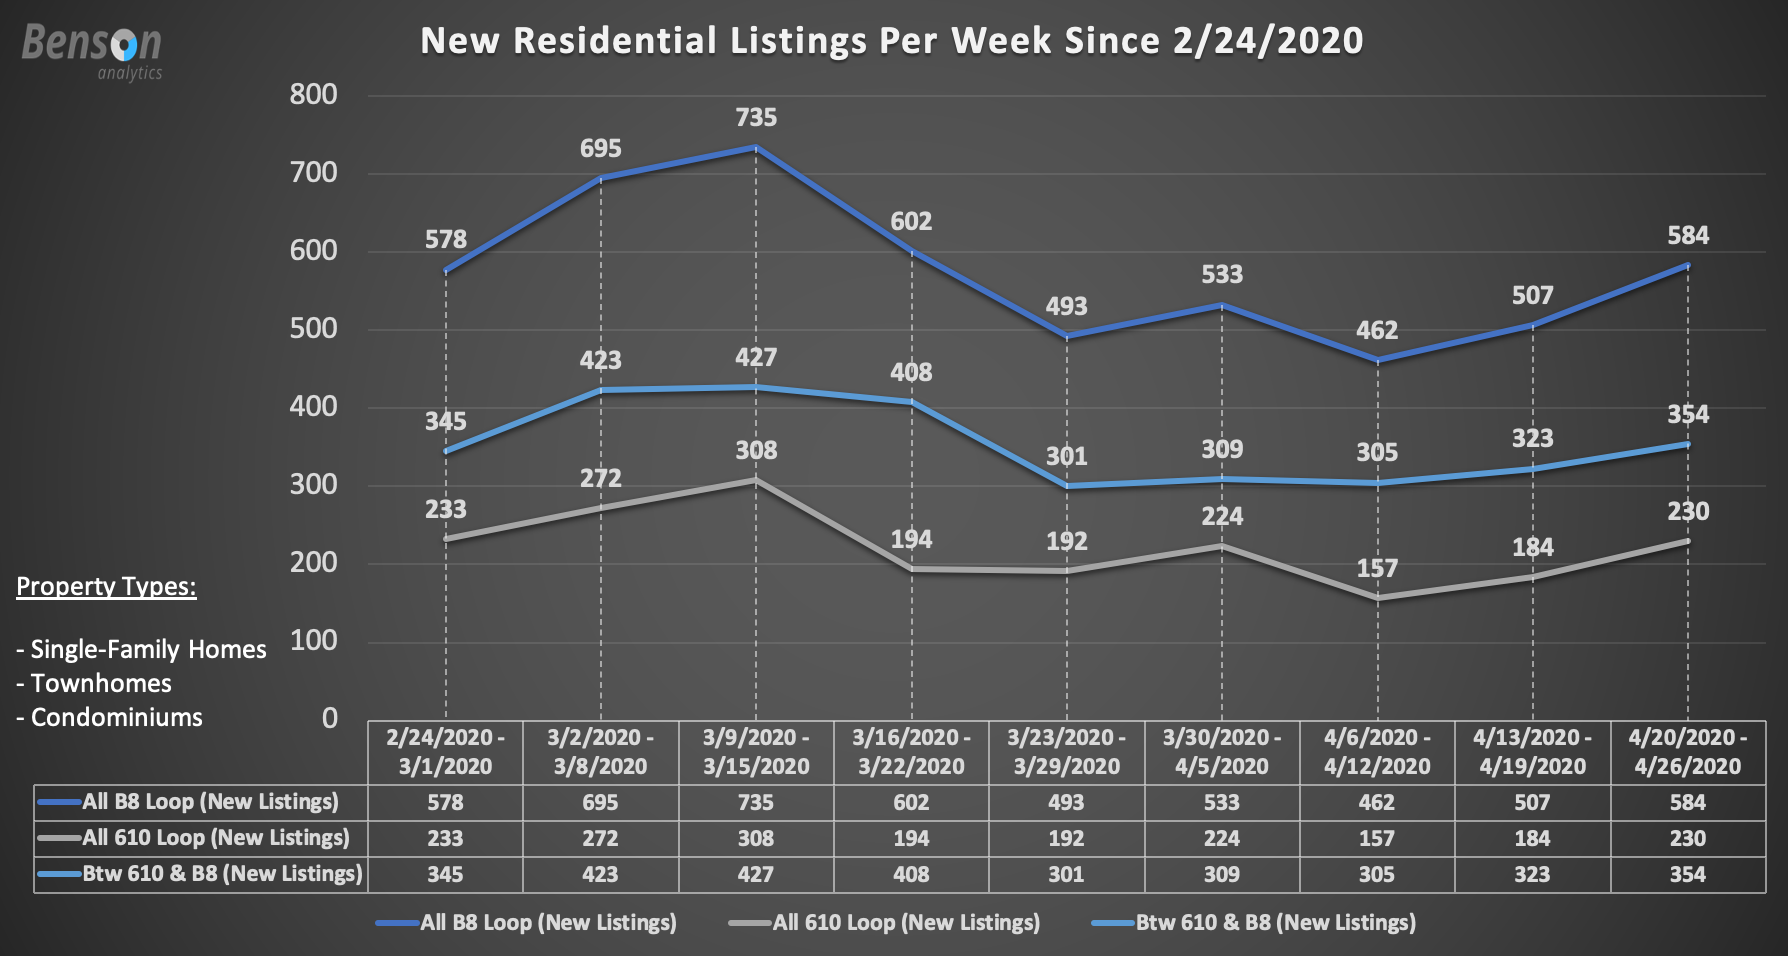
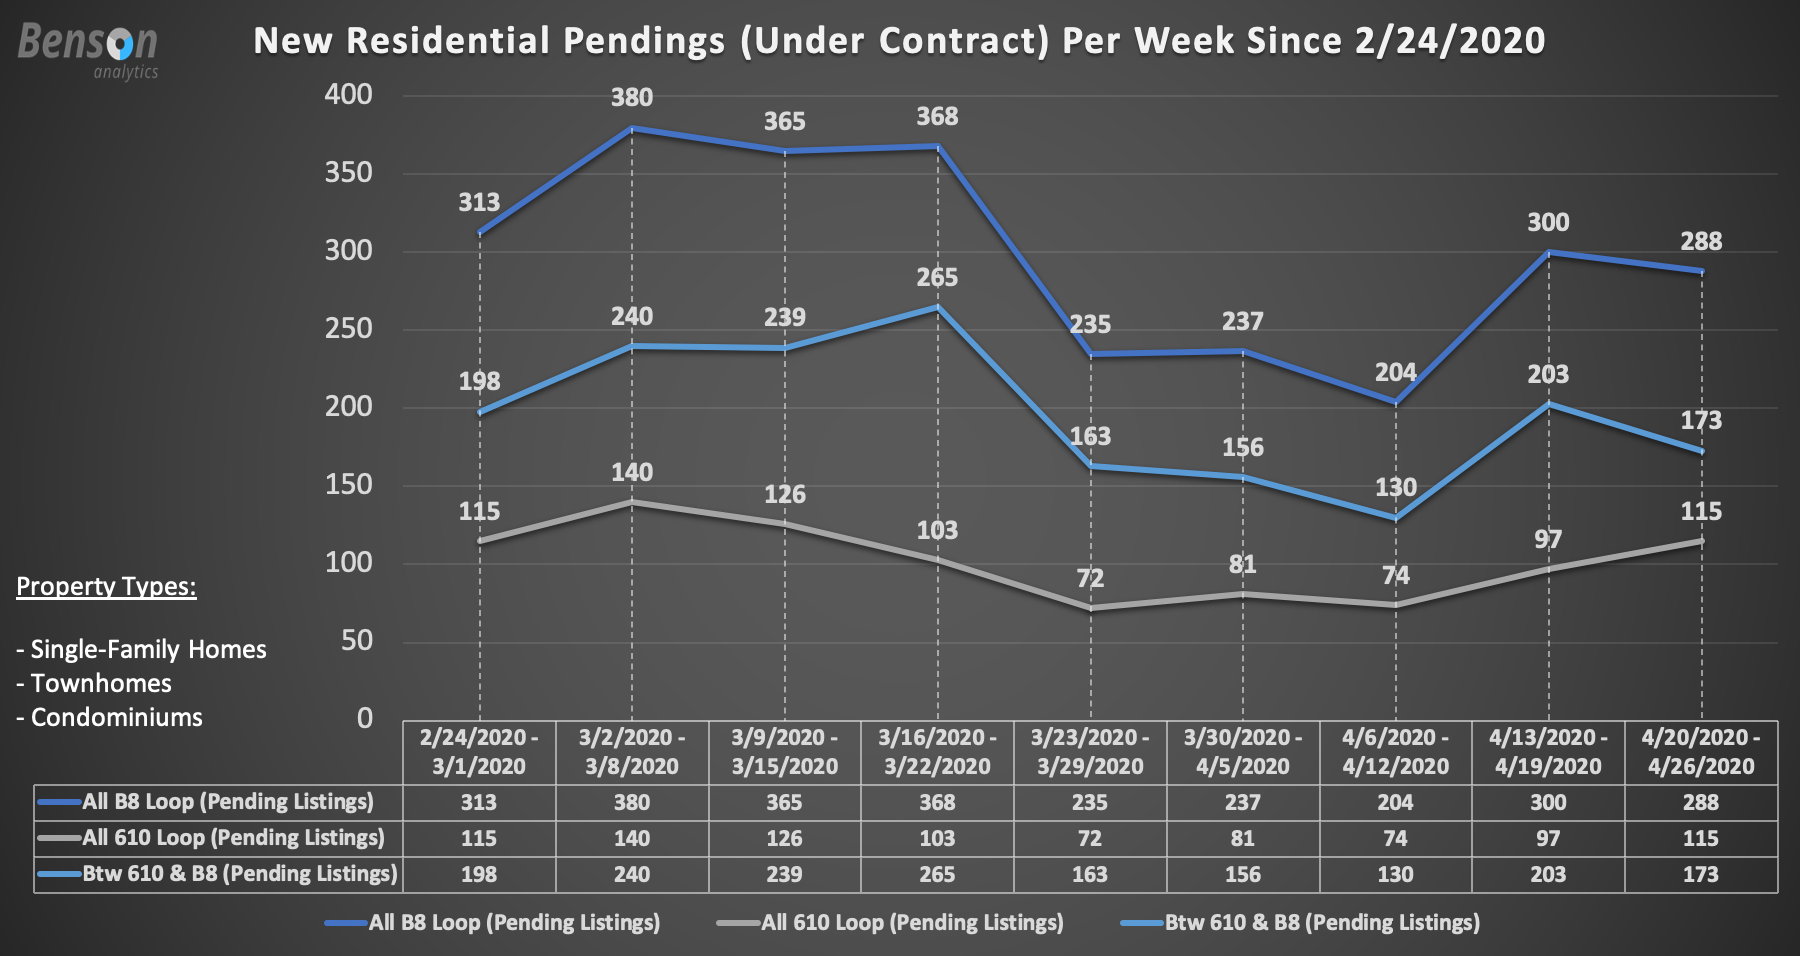
There’s A Slight ‘W’ Trend
As you can see above, there was a sharp decline in both new activity data points; however, the decline of new listings came first. What’s even more interesting is that for the week of 3/30/2020 – 4/5/2020, there were slight increases in activity for both new listings and pendings (except for Pendings between 610 & Beltway 8), then decreases again the week following. Though not extremely pronounced, we are seeing a slight ‘W’ trend in activity.
Looking more closely at this past week, I’d like to point out the fact that the activity is near or above the week of 2/24/2020 – 3/1/2020. This trend is one to keep an eye on!
Now On To Price Segments…
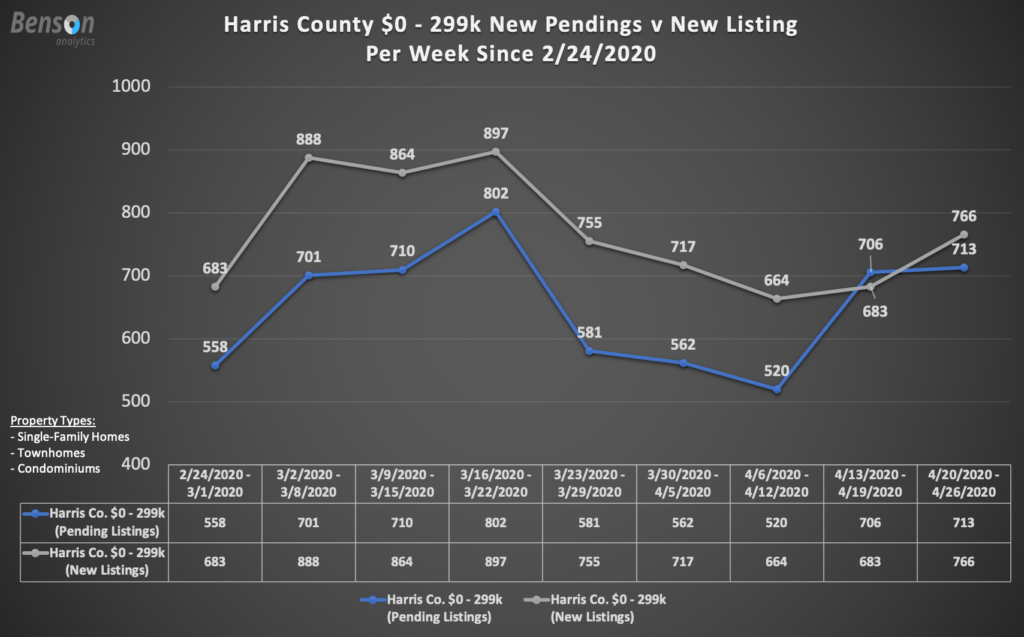
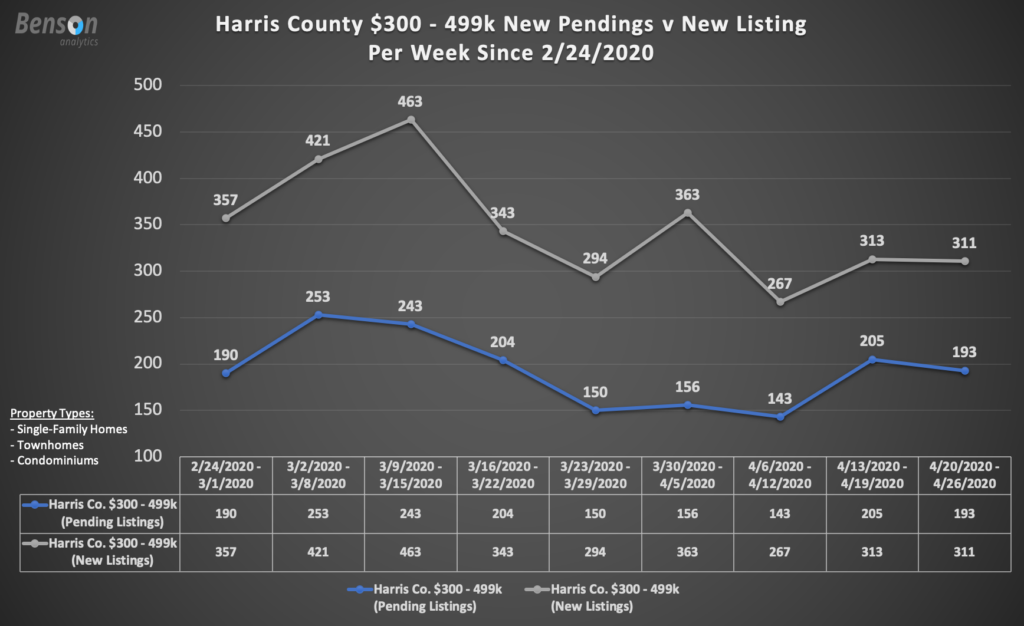
In addition to a location based analysis, we are monitoring the market based on price to gauge activity levels per price segment. For these weekly data sets, we have split the Harris County market into five segments:
- $0 – 299,000
- $300,000 – 499,000
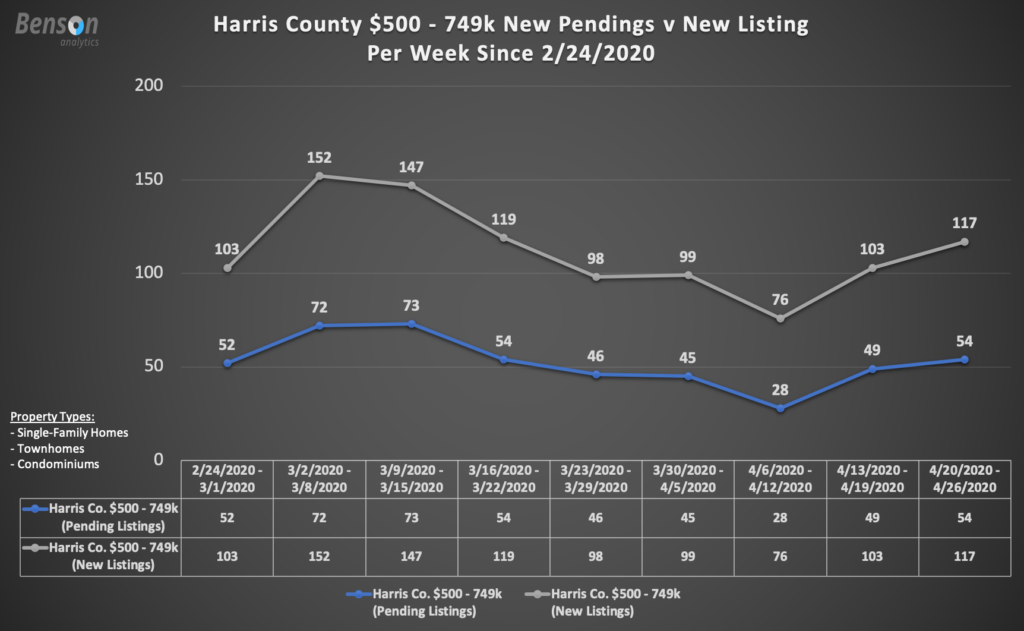
- $500,000 – 749,000
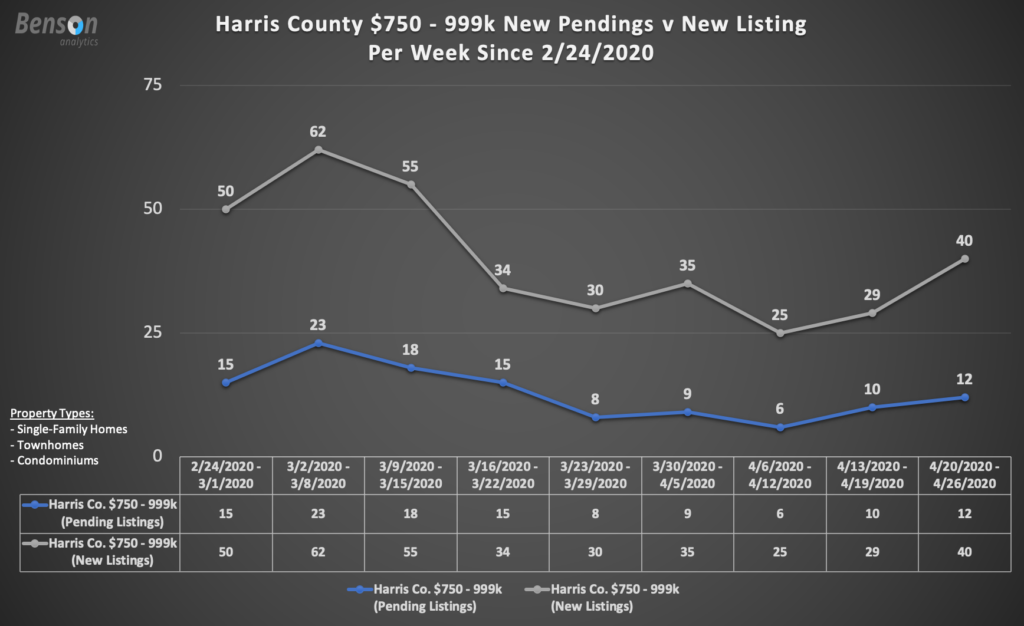
- $750,000 – 999,000
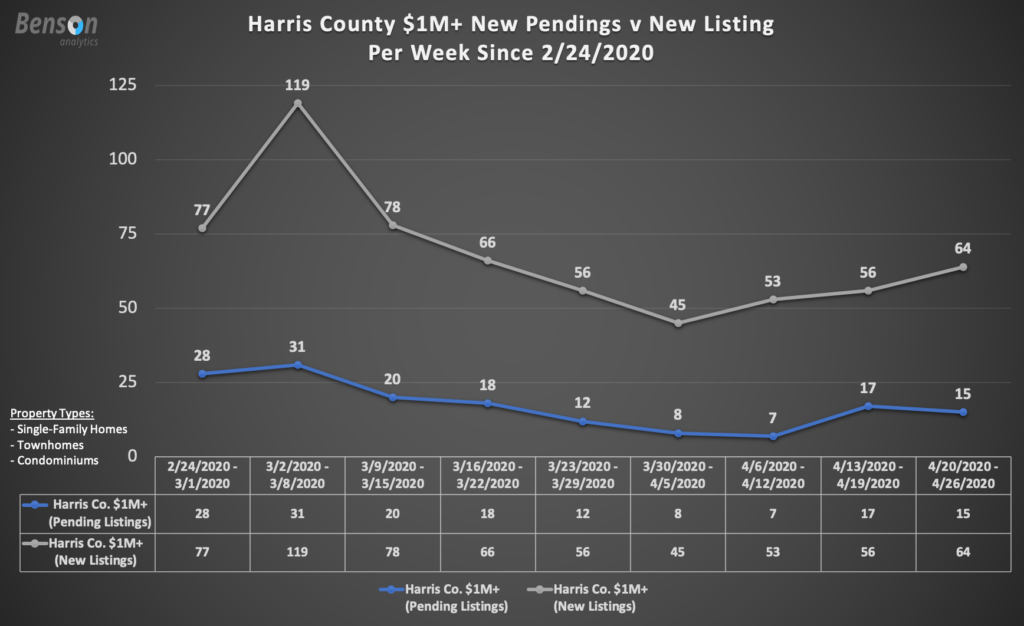
- $1,000,000+
Below, I will share with you the new activity trends for each segment for the last nice weeks along with commentary in the captions.
Over the coming days and weeks, we will continue to monitor the trends of our market for both price point and location. It’s important to stress that this is simply a high level view and may not be representative of your local market area. If you are interested in learning more about how your local market has been impacted, reach out to us directly!
Have any questions about the market? Just Ask!
Harris, Founder